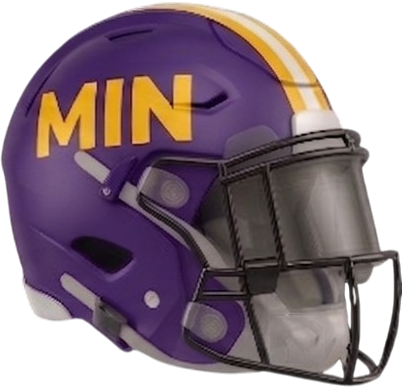
Minnesota
Vikings
Team Information
Division
NFC North
Founded
1961
Stadium
U.S. Bank Stadium
Stadium Address
401 Chicago Avenue
Minneapolis, MN 55415
All-Time Records
Through the current season. Updated automatically after each week's final scores.
All-Time
574-480-11
0.544 Win %
Regular Season
553-448-11
0.552 Win %
Postseason
21-32
0.396 Win %
Owner & President
Mark Wilf
General Manager
Nolan Teasley
Since 2026
Coaching Staff

Head Coach
Kevin O'Connell

Offensive Coordinator
Wes Phillips

Defensive Coordinator
Brian Flores

Special Teams
Matt Daniels
U.S. Bank Stadium
Stadium Profile
Seating Capacity
66,655
Year Built
2016
Roster
Last Updated 9-15-26
Offense
| # | Player | Pos | Ht | Wt | Exp | College | Base | Signing |
|---|---|---|---|---|---|---|---|---|
| 1 | Kyler Murray | QB | 5'10" | 207 | 8 | Oklahoma | $1.3M | — |
| 3 | Jordan Addison | WR | 5'11" | 179 | 4 | USC | $2.6M | $1.7M |
| 4 | Myles Price | WR | 5'9" | 183 | 2 | Indiana | $1.0M | — |
| 9 | J.J. McCarthy | QB | 6'3" | 219 | 3 | Michigan | — | — |
| 11 | Carson Wentz | QB | 6'5" | 237 | 11 | North Dakota State | $1.5M | $1.1M |
| 13 | Tai Felton | WR | 6'1" | 186 | 2 | Maryland | $1.1M | $280K |
| 14 | Jauan Jennings | WR | 6'3" | 212 | 6 | Tennessee | $1.6M | $4.5M |
| 18 | Justin Jefferson | WR | 6'1" | 195 | 7 | LSU | $1.2M | $13.4M |
| 21 | Demond Claiborne | RB | 5'10" | 188 | R | Wake Forest | — | — |
| 27 | Jordan Mason | RB | 5'11" | 230 | 5 | Georgia Tech | $4.7M | $800K |
| 33 | Aaron Jones | RB | 5'9" | 208 | 10 | Texas-El Paso | $5M | $4.8M |
| 45 | Max Bredeson | RB | 6'2" | 252 | R | Michigan | $885K | $123K |
| 60 | Joe Huber | G | 6'5" | 310 | 2 | Wisconsin | $1.0M | $3K |
| 64 | Blake Brandel | OT | 6'7" | 315 | 6 | Oregon State | $3.4M | $667K |
| 65 | Michael Jurgens(IR) | G | 6'4" | 311 | 3 | Wake Forest | $1.1M | $27K |
| 71 | Christian Darrisaw | OT | 6'5" | 315 | 6 | Virginia Tech | $1.2M | $6.7M |
| 72 | Ryan Van Demark | OT | 6'6" | 307 | 4 | Connecticut | $1.6M | $2.5M |
| 74 | Donovan Jackson | G | 6'4" | 324 | 2 | Ohio State | — | — |
| 75 | Brian O'Neill | OT | 6'7" | 310 | 9 | Pittsburgh | $5.1M | $9.1M |
| 76 | Will Fries | G | 6'6" | 321 | 6 | Penn State | $12.6M | $4M |
| 78 | Caleb Tiernan | OT | 6'7" | 323 | R | Northwestern | $885K | $332K |
| 82 | Jeshaun Jones(IR) | WR | 6'1" | 188 | 1 | Maryland | — | — |
| 83 | Bryson Nesbit(IR) | TE | 6'5" | 228 | 1 | North Carolina | — | — |
| 84 | Josh Oliver | TE | 6'5" | 264 | 8 | San Jose State | — | — |
| 85 | Ben Yurosek(IR) | TE | 6'4" | 251 | 2 | Georgia | $1.0M | $7K |
| 86 | Gavin Bartholomew | TE | 6'5" | 249 | 2 | Pittsburgh | $1.0M | $54K |
| 87 | T.J. Hockenson | TE | 6'5" | 248 | 8 | Iowa | $7M | $5.4M |
| — | DeeJay Dallas | RB | 5'10" | 225 | 7 | Miami | $1.2M | — |
| — | Trevor Keegan | G | 6'5" | 315 | 3 | Michigan | — | — |
| — | Nick Samac | C | 6'4" | 317 | 3 | Michigan State | — | — |
Defense
| # | Player | Pos | Ht | Wt | Exp | College | Base | Signing |
|---|---|---|---|---|---|---|---|---|
| 2 | Isaiah Rodgers | CB | 5'10" | 180 | 6 | UMass Amherst | $4.4M | $2.9M |
| 5 | Zemaiah Vaughn | CB | 6'3" | 180 | 1 | Utah | $885K | — |
| 7 | Byron Murphy | CB | 5'11" | 190 | 8 | Washington | $1.3M | $6.4M |
| 8 | Jakobe Thomas | S | 6'1" | 211 | R | Miami | $885K | $332K |
| 15 | Dallas Turner | LB | 6'3" | 247 | 3 | Alabama | $1.1M | $2.1M |
| 20 | Charles Demmings | CB | 6'1" | 193 | R | Stephen F. Austin State | $885K | $120K |
| 23 | James Pierre | CB | 6'2" | 185 | 7 | Florida Atlantic | $1.2M | $1.3M |
| 24 | Jay Ward | S | 6'1" | 190 | 4 | LSU | $1.1M | $163K |
| 26 | Theo Jackson | S | 6'1" | 205 | 5 | Tennessee | $1.3M | $1M |
| 28 | Tyreek Chappell(IR) | CB | 5'11" | 180 | R | Texas A&M | — | — |
| 32 | Jamal Adams(IR) | LB | 6'1" | 213 | 10 | LSU | — | — |
| 39 | Jacob Thomas | S | 6'1" | 212 | R | James Madison | $885K | $3K |
| 40 | Chaz Chambliss | LB | 6'1" | 244 | 2 | Georgia | $1.0M | $7K |
| 41 | Jake Golday | LB | 6'4" | 240 | R | Cincinnati | $885K | $861K |
| 43 | Andrew Van Ginkel | OLB | 6'4" | 242 | 8 | Wisconsin | $15.4M | $3.4M |
| 44 | Josh Metellus | S | 5'11" | 207 | 7 | Michigan | $3.4M | $2M |
| 50 | Levi Drake Rodriguez | DL | 6'2" | 307 | 3 | East Texas A&M | $1.1M | $26K |
| 51 | Blake Cashman | LB | 6'1" | 235 | 8 | Minnesota | $6.9M | $1.6M |
| 55 | Eric Wilson | LB | 6'1" | 230 | 10 | Cincinnati | $1.4M | $2.1M |
| 61 | Jalen Redmond | DL | 6'3" | 305 | 3 | Oklahoma | $1.1M | — |
| 90 | Tyrion Ingram-Dawkins | DT | 6'5" | 290 | 2 | Georgia | $1.0M | $119K |
| 92 | Tyler Batt(IR) | LB | 6'5" | 271 | 2 | BYU | — | — |
| 94 | Taki Taimani(IR) | DL | 6'1" | 324 | 2 | Oregon | — | — |
| 95 | Caleb Banks | DT | 6'6" | 329 | R | Florida | $885K | $3.0M |
| 97 | Domonique Orange | DT | 6'2" | 322 | R | Iowa State | $885K | $385K |
| 98 | Bo Richter | LB | 6'1" | 248 | 3 | Air Force | $1.1M | — |
| 99 | Elijah Williams | DE | 6'3" | 298 | 2 | Morgan State | $1.0M | — |
| — | Ivan Pace, Jr. | LB | 5'10" | 236 | 4 | Cincinnati | $3.5M | — |
| — | Kyle Van Noy | MLB | 6'3" | 255 | 13 | BYU | $1.3M | $1.4M |
| — | Harrison Smith | S | 6'2" | 211 | 15 | Notre Dame | $1.3M | $2.1M |
Special Teams
| # | Player | Pos | Ht | Wt | Exp | College | Base | Signing |
|---|---|---|---|---|---|---|---|---|
| 16 | Will Reichard | K | 6'1" | 190 | 3 | Alabama | $1.1M | $43K |
| 42 | Andrew DePaola | LS | 6'1" | 227 | 12 | Rutgers | $1.5M | $188K |
| 47 | Brett Thorson | P | 6'1" | 237 | R | Georgia | $885K | $5K |
Year-by-Year Record
| Year | Record | Result |
|---|---|---|
| 2025 | 9-8-0 | No Playoffs |
| 2024 | 14-3-0 | Lost in Playoffs |
| 2023 | 7-10-0 | No Playoffs |
| 2022 | 13-4-0 | Lost in Playoffs |
| 2021 | 8-9-0 | No Playoffs |
| 2020 | 7-9-0 | No Playoffs |
| 2019 | 10-6-0 | Lost in Playoffs |
| 2018 | 8-7-1 | No Playoffs |
| 2017 | 13-3-0 | Lost in Playoffs |
| 2016 | 8-8-0 | No Playoffs |
| 2015 | 11-5-0 | Lost in Playoffs |
| 2014 | 7-9-0 | No Playoffs |
| 2013 | 5-10-1 | No Playoffs |
| 2012 | 10-6-0 | Lost in Playoffs |
| 2011 | 3-13-0 | No Playoffs |
| 2010 | 6-10-0 | No Playoffs |
| 2009 | 12-4-0 | Lost in Playoffs |
| 2008 | 10-6-0 | Lost in Playoffs |
| 2007 | 8-8-0 | No Playoffs |
| 2006 | 6-10-0 | No Playoffs |
| 2005 | 9-7-0 | No Playoffs |
| 2004 | 8-8-0 | Lost in Playoffs |
| 2003 | 9-7-0 | No Playoffs |
| 2002 | 6-10-0 | No Playoffs |
| 2001 | 5-11-0 | No Playoffs |
| 2000 | 11-5-0 | Lost in Playoffs |
| 1999 | 10-6-0 | Lost in Playoffs |
| 1998 | 15-1-0 | Lost in Playoffs |
| 1997 | 9-7-0 | Lost in Playoffs |
| 1996 | 9-7-0 | Lost in Playoffs |
| 1995 | 8-8-0 | No Playoffs |
| 1994 | 10-6-0 | Lost in Playoffs |
| 1993 | 9-7-0 | Lost in Playoffs |
| 1992 | 11-5-0 | Lost in Playoffs |
| 1991 | 8-8-0 | No Playoffs |
| 1990 | 6-10-0 | No Playoffs |
| 1989 | 10-6-0 | Lost in Playoffs |
| 1988 | 11-5-0 | Lost in Playoffs |
| 1987 | 8-7-0 | Lost in Playoffs |
| 1986 | 9-7-0 | No Playoffs |
| 1985 | 7-9-0 | No Playoffs |
| 1984 | 3-13-0 | No Playoffs |
| 1983 | 8-8-0 | No Playoffs |
| 1982 | 5-4-0 | Lost in Playoffs |
| 1981 | 7-9-0 | No Playoffs |
| 1980 | 9-7-0 | Lost in Playoffs |
| 1979 | 7-9-0 | No Playoffs |
| 1978 | 8-7-1 | Lost in Playoffs |
| 1977 | 9-5-0 | Lost in Playoffs |
| 1976 | 11-2-1 | Lost Super Bowl |
| 1975 | 12-2-0 | Lost in Playoffs |
| 1974 | 10-4-0 | Lost Super Bowl |
| 1973 | 12-2-0 | Lost Super Bowl |
| 1972 | 7-7-0 | No Playoffs |
| 1971 | 11-3-0 | Lost in Playoffs |
| 1970 | 12-2-0 | Lost in Playoffs |
| 1969 | 12-2-0 | Lost Super Bowl |
| 1968 | 8-6-0 | Lost in Playoffs |
| 1967 | 3-8-3 | No Playoffs |
| 1966 | 4-9-1 | No Playoffs |
| 1965 | 7-7-0 | No Playoffs |
| 1964 | 8-5-1 | No Playoffs |
| 1963 | 5-8-1 | No Playoffs |
| 1962 | 2-11-1 | No Playoffs |
| 1961 | 3-11-0 | No Playoffs |
Playoff Records
All-time postseason performance through the 2025 season.
Games Played
53
Wins
21
Losses
32
Win %
.396
Last Appearance
2024
Game by Game
52 games2024
Wild Card
Los Angeles Rams
Away
2022
Wild Card
New York Giants
Home
2019
Wild Card
New Orleans Saints
Away
2019
Divisional
San Francisco 49ers
Away
2017
Divisional
New Orleans Saints
Home
2017
NFC Championship
Philadelphia Eagles
Away
2015
Wild Card
Seattle Seahawks
Home
2012
Wild Card
Green Bay Packers
Away
2009
Divisional
Dallas Cowboys
Home
2009
NFC Championship
New Orleans Saints
Away
2008
Wild Card
Philadelphia Eagles
Home
2004
Wild Card
Green Bay Packers
Away
2004
Divisional
Philadelphia Eagles
Away
2000
Divisional
New Orleans Saints
Home
2000
NFC Championship
New York Giants
Away
1999
Wild Card
Dallas Cowboys
Home
1999
Divisional
St. Louis Rams
Away
1998
Divisional
Arizona Cardinals
Home
1998
NFC Championship
Atlanta Falcons
Home
1997
Wild Card
New York Giants
Home
1997
Divisional
San Francisco 49ers
Away
1996
Wild Card
Dallas Cowboys
Away
1994
Wild Card
Chicago Bears
Home
1993
Wild Card
New York Giants
Home
1992
Wild Card
Washington Redskins
Home
1989
Divisional
San Francisco 49ers
Away
1988
Wild Card
Los Angeles Rams
Home
1988
Divisional
San Francisco 49ers
Away
1987
Wild Card
New Orleans Saints
Away
1987
Divisional
San Francisco 49ers
Away
1987
NFC Championship
Washington Redskins
Away
1982
Divisional
Washington Redskins
Away
1980
Divisional
Philadelphia Eagles
Away
1978
Divisional
Los Angeles Rams
Away
1977
Divisional
Los Angeles Rams
Home
1977
NFC Championship
Dallas Cowboys
Away
1976
Divisional
Washington Redskins
Home
1976
NFC Championship
Los Angeles Rams
Home
1976
Super Bowl XI
Oakland Raiders
Neutral
1975
Divisional
Dallas Cowboys
Home
1974
Divisional
St. Louis Cardinals
Home
1974
NFC Championship
Los Angeles Rams
Home
1974
Super Bowl IX
Pittsburgh Steelers
Neutral
1973
Divisional
Washington Redskins
Home
1973
NFC Championship
Dallas Cowboys
Home
1973
Super Bowl VIII
Miami Dolphins
Neutral
1971
Divisional
Dallas Cowboys
Away
1970
Divisional
San Francisco 49ers
Away
1969
Western Conference Championship
Los Angeles Rams
Home
1969
NFL Championship
Cleveland Browns
Home
1969
Super Bowl IV
Kansas City Chiefs
Neutral
1968
Western Conference Championship
Baltimore Colts
Away
Super Bowl History
Super Bowl 4
Jan. 11, 1970
7–23
vs.
Kansas City Chiefs
Super Bowl 8
Jan. 13, 1974
7–24
vs.
Miami Dolphins
Super Bowl 9
Jan. 12, 1975
6–16
vs.
Pittsburgh Steelers
Super Bowl 11
Jan. 9, 1977
14–32
vs.
Oakland Raiders
Hall of Famers
Pro Football Hall of Fame inductees who spent part of their career with the franchise.
- Jared Allen - Inducted: 2025 - Years with team: 2008–2013
- Morten Andersen - Inducted: 2017 - Years with team: 2004
- Cris Carter - Inducted: 2013 - Years with team: 1990–2001
- Dave Casper - Inducted: 2002 - Years with team: 1983
- Chris Doleman - Inducted: 2012 - Years with team: 1985–1993, 1999
- Carl Eller - Inducted: 2004 - Years with team: 1964–1978
- Brett Favre - Inducted: 2016 - Years with team: 2009–2010
- Jim Finks - Inducted: 1995 - Years with team: 1964–1973
- Bud Grant - Inducted: 1994 - Years with team: 1967–1983, 1985
- Steve Hutchinson - Inducted: 2020 - Years with team: 2006–2011
- Paul Krause - Inducted: 1998 - Years with team: 1968–1979
- Jim Langer - Inducted: 1987 - Years with team: 1980–1981
- Randall McDaniel - Inducted: 2009 - Years with team: 1988–1999
- Hugh McElhenny - Inducted: 1970 - Years with team: 1961–1962
- Warren Moon - Inducted: 2006 - Years with team: 1994–1996
- Randy Moss - Inducted: 2018 - Years with team: 1998–2004, 2010
- Alan Page - Inducted: 1988 - Years with team: 1967–1978
- John Randle - Inducted: 2010 - Years with team: 1990–2000
- Jan Stenerud - Inducted: 1991 - Years with team: 1984–1985
- Fran Tarkenton - Inducted: 1986 - Years with team: 1961–1966, 1972–1978
- Mick Tingelhoff - Inducted: 2015 - Years with team: 1962–1978
- Ron Yary - Inducted: 2001 - Years with team: 1968–1981
- Gary Zimmerman - Inducted: 2008 - Years with team: 1986–1992
- Roger Craig - Inducted: 2026 - Years with team: 1992–1993
Awards
League MVP, Offensive Player of the Year, Defensive Player of the Year, and Walter Payton Man of the Year.